Implied Volatility – The Weather of Markets
Implied Volatility is the market’s mood meter — like checking the weather before stepping out. This edition breaks it down with fun analogies so you can spot signals, price options better, and more...
Before we begin:
Welcome to the fifth edition of our Trading Newsletter! Our hope with this newsletter is simple: every trader in Mumbai, Rajkot, Trichy, Kolkata, Faridabad, or elsewhere - every Indian trader - can speak the language of the markets once they read every edition of Indicator by Dhan. In this one, we dive into the world of Implied Volatility through the lens of weather, travel, and your own smile! So grab your chai and let’s get started.
Implied Volatility (IV) is like checking the weather before stepping out. If it looks sunny, you grab your sunglasses and move. But if the sky’s a bit grey and the wind’s picking up, even if it hasn’t rained yet, you carry an umbrella. You know, just in case.
That’s what the Market does, too. When things feel uncertain, traders start preparing for downsides. It's not about what actually has happened (that’s historical volatility), but what people think could happen.
And this sentiment, this nervous energy or lack thereof, directly impacts how much people are willing to pay for Options, which are essentially your “insurance policies” against wild moves.
The Core Idea of IV
Let us approach the concept of Implied Volatility (IV) through the lens of surge pricing on Uber. It’s levied when there’s a sudden spike in activity - heavy rain, sharp traffic, a big concert just ending.
You open your app, and suddenly that ₹250 ride home now costs a whopping ₹700. Why?
Because demand has spiked, the system adjusts the price accordingly.
Now, picture a calm evening with no traffic and clear skies. That same ride goes back to its normal price, maybe even lower if no one is booking.
Options work in a similar way.
When markets are nervous and uncertain, everyone wants some sort of safety net. They start buying options, and as demand increases, prices rise.
But when the market is calm and people feel confident, the demand for options drops, and so do the prices. It’s like a balloon slowly losing air when the panic fades.
The interesting thing is that Implied Volatility isn’t something you can see or measure directly. It’s not printed anywhere on the screen. Instead, it’s something traders infer from the price of an option.
Here’s a simple example. Imagine a last-minute flight from Mumbai to Goa is suddenly priced at ₹15,000. You don’t need to ask the airline what’s going on. You just know something’s up.
Maybe it’s peak tourist season, maybe it’s New Year’s Eve, or maybe there’s a big music festival happening in Goa. The point is, the price of the ticket gives you a clue about demand and mood.
Suppose the NIFTY is at 24,000 and a weekly ATM Call Option is trading at a hefty premium - say, ₹250, when normally it hovers around ₹150.
You haven’t seen tomorrow’s news yet, but the option price is telling you something: traders are expecting a big move, maybe an RBI announcement, budget news, or unexpected global cues.
Just like that overpriced flight, the expensive option hints at the market’s mood — nervous, excited, or bracing for turbulence. That hint is Implied Volatility.
You see that an option is expensive, and you think, “Okay, the market must be expecting something big. Maybe an event is around the corner, or maybe there’s some news coming.”
You don’t get told directly. Instead, you back-calculate the price and get a sense of how much turbulence the market expects.
In that way, Implied Volatility is like reading the room without asking anyone directly. It’s a silent signal, baked into prices, that helps traders decide whether the market is calm or gearing up for a storm.
What Moves Implied Volatility?
Implied Volatility doesn’t move randomly. It reacts to a mix of real events, crowd psychology, and plain old fear or confidence, kind of like the weather. Sometimes the sky is actually cloudy, and sometimes someone just thinks they saw lightning.
1. Big Events Create Big Uncertainty
Things like Budget, Elections, earnings announcements or central bank decisions usually shake things up.
The market doesn’t know whether the outcome will be good or bad, so traders get nervous and start buying options to prepare for big moves.
This rush to hedge or even speculate causes IVs to rise. It’s like people checking the weather app before a trip and packing for both rain and sunshine, just in case.
2. Fear Spreads Fast
When markets suddenly drop or bad news hits the headlines, traders go into panic mode. It’s like someone yelling “Fire!” in a crowded movie theatre.
Everyone scrambles for the exits at once. In trading, this means a mad rush for protective puts or hedges. As demand surges, option prices rise, and so does implied volatility.
3. Calm Markets Make IV Drowsy
When everything is stable, like in a steady bull market or during low-volume holiday weeks, there’s no sense of urgency.
Traders feel safe, fewer people are buying insurance in the form of options, and prices fall.
It’s like a peaceful Sunday afternoon. No drama, no noise, just low IV drifting along slowly.
4. Supply and Demand Dynamics Also Matter
Even without major headlines, implied volatility can move based on how crowded the options market is.
Just like in a neighbourhood where all car owners rush to get burglar alarms as demand for protection spikes, prices inflate. That inflation is reflected directly in IV.
IV Smile, Skew, and All That Jazz
Here’s a fun exercise. Go to a mirror and smile. Look at it and observe what you see - your smile is sharp, clean, and could light up a room.
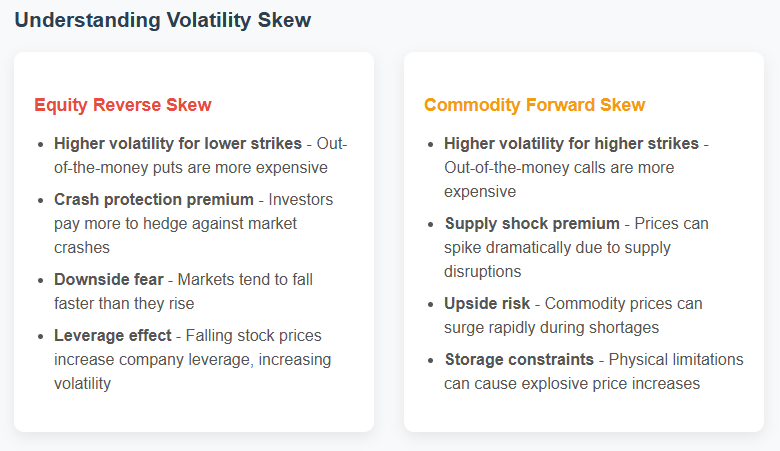
That’s what the theoretical IV smile looks like. But in reality? Markets are messy. The smile turns lopsided, forming a “skew.”
In equities, it’s like everyone’s afraid the stock will fall off a cliff — so downside protection (puts) costs more. That’s a reverse skew.
In commodities, everyone’s worried about prices spiking because of droughts or wars. So calls get pricier — that’s a forward skew.
Time Factor - Term Structure
Let’s say you’re planning two trips: one this weekend and another six months from now. The weather forecast for this weekend is spot on, but for six months? Pure guesswork. That’s how IV behaves with time.
If near-term IV is low and long-term is high — we call it Contango (yeah, sounds like a dance).
If short-term IV is spiking because something big is brewing — like an earnings release or budget day — you get Backwardation.
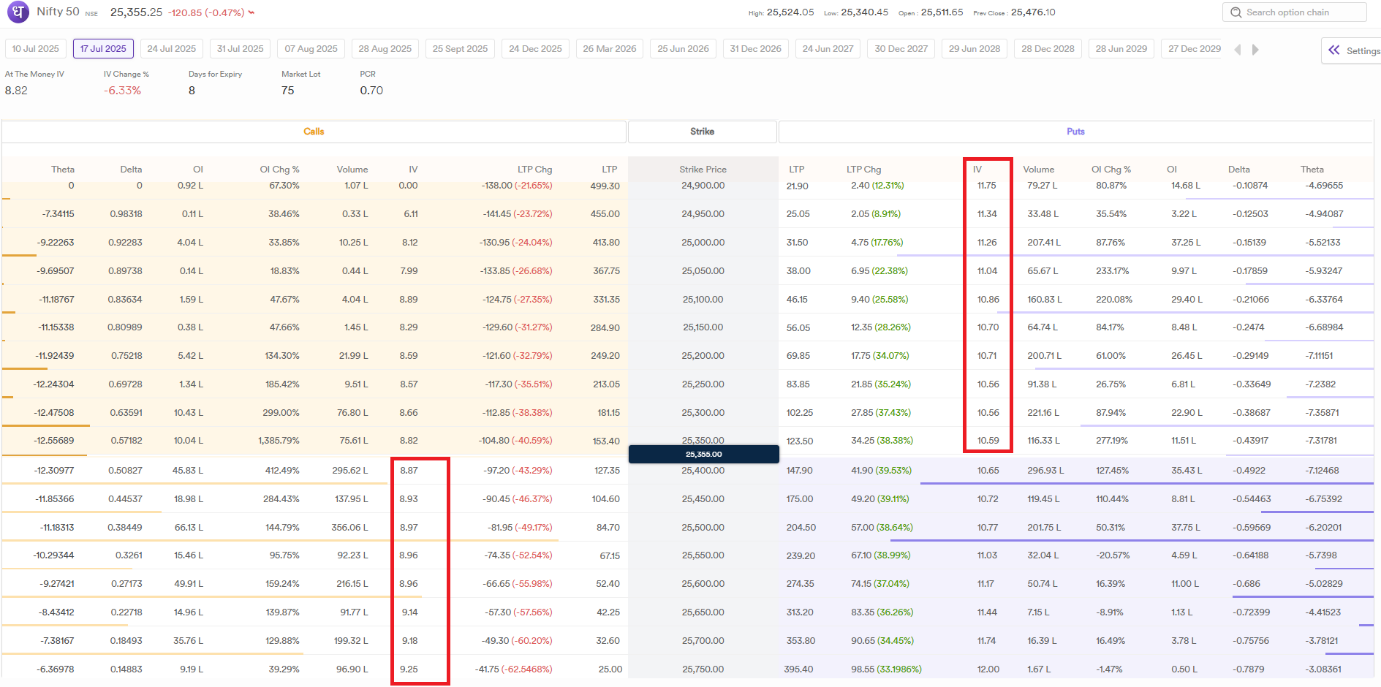
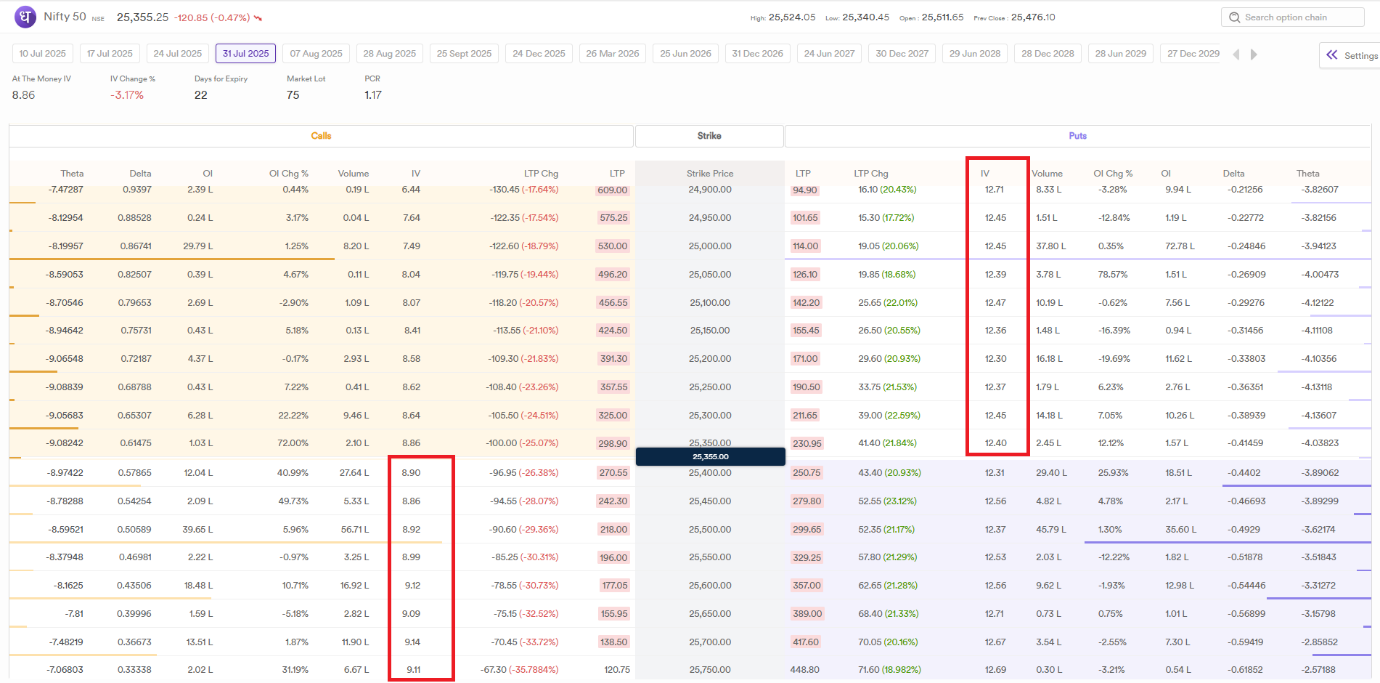
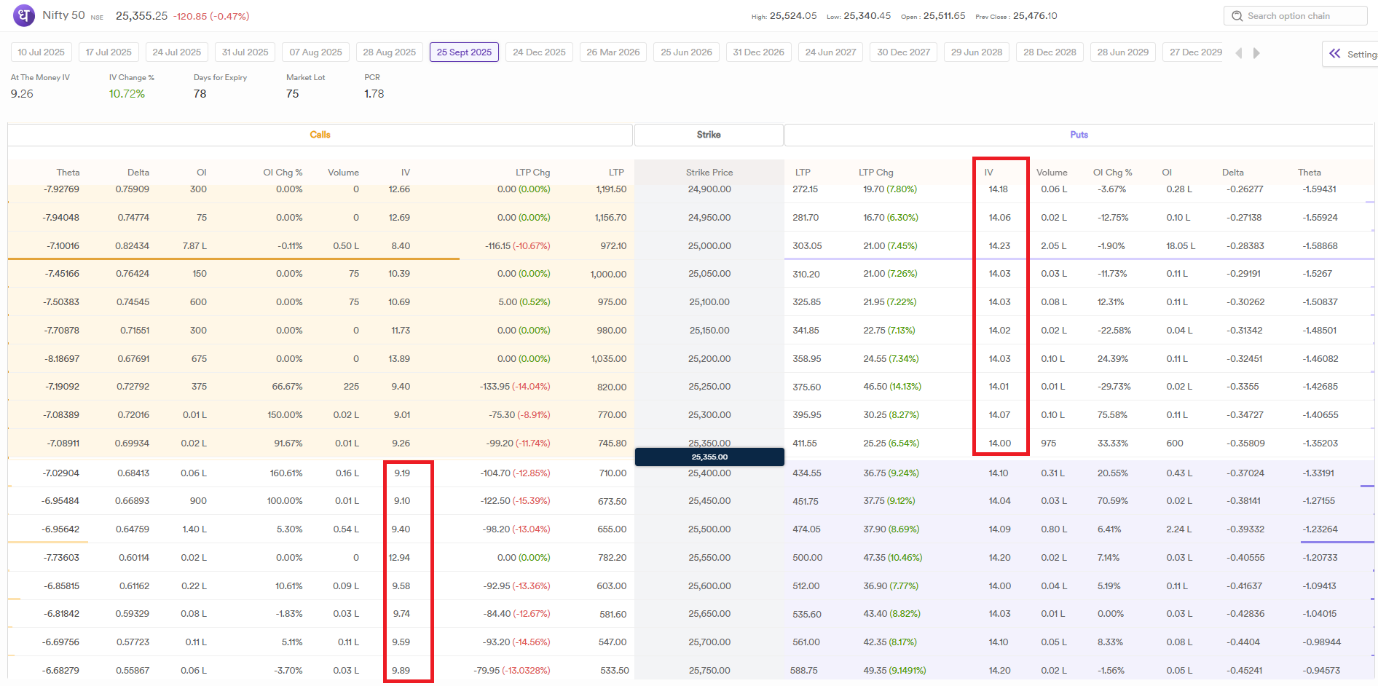
In the following case, while the ATM IVs for both the 17th July and 31st July expiries remain at similar levels, the OTM Put IVs are noticeably higher for the 31st July expiry, and rise even further for the 25th September expiry.
17th July:
31st July:
25th September:
IV Rank vs IV Percentile: Spotting Extremes
Think of IV Rank like checking today’s temperature vs yearly highs/lows.
IV Percentile is more like checking how many days were cooler than today.
Both help you figure out if volatility is relatively “cheap” or “expensive.”
High IV Rank? Consider selling options.
Low IV Percentile? Maybe time to buy some premium.
Real-World Stuff: Why IV Matters
Want to hedge your portfolio? IV helps you time your protection purchases.
Want to generate income? Use IV to decide when to sell options.
Trading during earnings? Watch out: IV spikes before and crashes after. Don’t get caught overpaying.
Okay, So How Do We Trade This?
Here’s where it gets interesting. You don’t always need to bet on whether a stock will go up or down. You can bet on whether it will get noisy or stay quiet. That’s volatility trading.
When IV is High:
Short Straddles/Strangles: Like selling insurance when everyone’s paranoid. If nothing happens, you pocket the premium.
Iron Condors: Bet that price stays in a tight range. It’s the “I’ll take my 1% and sleep well” strategy.
Covered Calls: Own stock, sell calls, milk the high premiums. Like renting out your house during peak tourist season.
When IV is Low:
Long Straddles/Strangles: Betting something will happen, even if we don’t know what.
Calendar Spreads: Mix and match expiries, play the IV time game.
Ratio Spreads: Sell expensive, buy cheap and take advantage of skew.
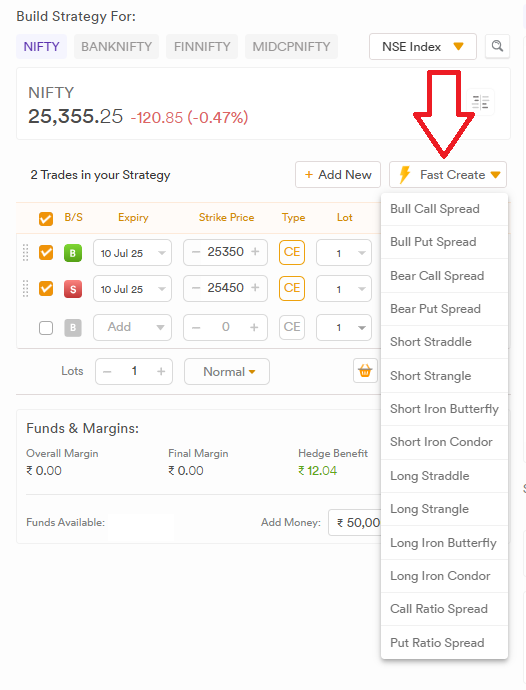
You can pick the range of Strategies at our Options Trader / Strategy Builder:
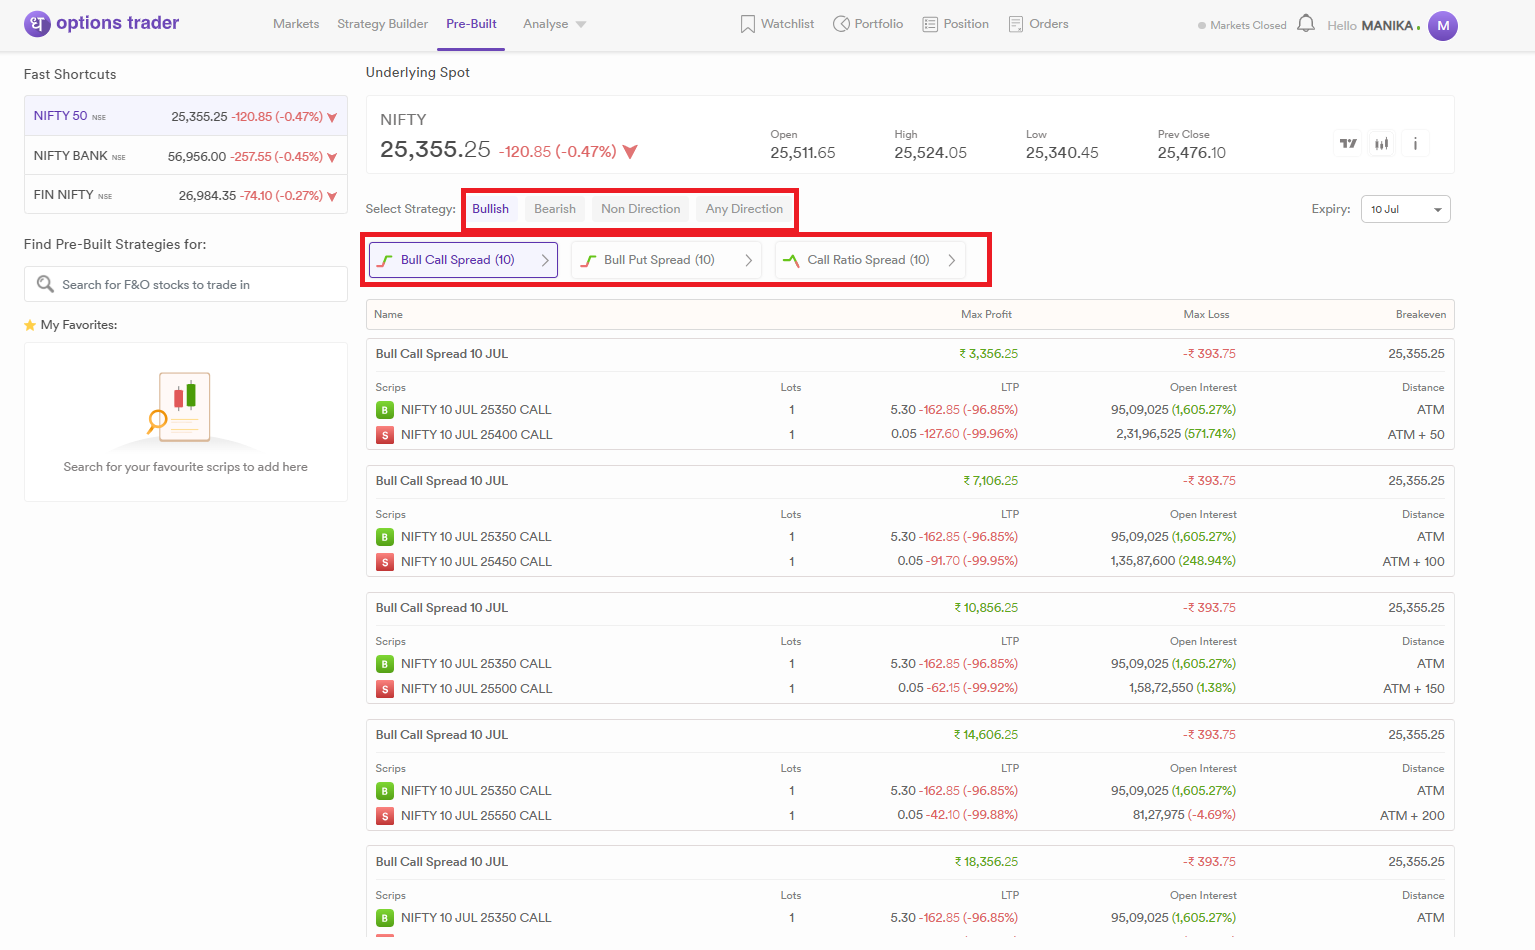
Or, just go to Options Trader / Pre-Built and check out the work made easy for you:
The Secret Sauce
Implied Volatility isn’t just math. It is the market’s psychology presented to you wearing a suit.
IV reflects emotion, fear, greed, expectations — everything. If price action is the what, IV is the why.
Mastering it is like learning to read body language. Once you get the hang of it, you start seeing patterns others miss.
You spot opportunities not because you're guessing where the price will go, but because you understand how the crowd is behaving.
And honestly? That’s half the battle in trading — knowing what everyone thinks will happen, and positioning yourself just a bit ahead of them.
Great job 👏🏻